Your trades
Works with: the table from an MT4/MT5 report copied in the browser, a cTrader history CSV, a Tradovate Performance CSV, or columns from your own journal spreadsheet (Open Time, Close Time, Symbol, Type, Lots, Commission, Swap, Profit, Setup). Tab, comma or semicolon; numbers as 1,234.56 or $(25.00). Deposits and withdrawals are skipped. Dates like 10/05/2026 are read as month/day unless the file shows a day above 12 first.
Spread or slippage per symbol ($ per 1 lot or 1 contract, round trip)
Your account's typical spread × value per point. EURUSD: 0.2 pip × $10 per pip and lot = $2.00. Futures: ticks you usually lose × tick value (MNQ 1 tick = $0.50, MES 1 tick = $1.25). An empty box counts as 0.
Pro: your price action trading journal across months
- Open the file: MT4 "Detailed Statement" (HTML), MT5 report (HTML), cTrader CSV or Tradovate Performance CSV, no copying.
- A journal that grows: any number of accounts (live, demo, prop challenge); each new week is added and duplicate tickets are recognised.
- Tag the setup: MT4, MT5 and Tradovate files have no setup column; you assign each loaded trade to your pattern in one box (the cTrader label is taken over).
- Every setup month by month: net expectancy per month, so you see a setup fading before your account does.
- CSV for Excel or Google Sheets, a report to print or save as PDF, a weekly review reminder (.ics for Google Calendar or Outlook) and a JSON backup.
Pro: $9 per month or $69 per year, any number of accounts and trades.
How it is computed
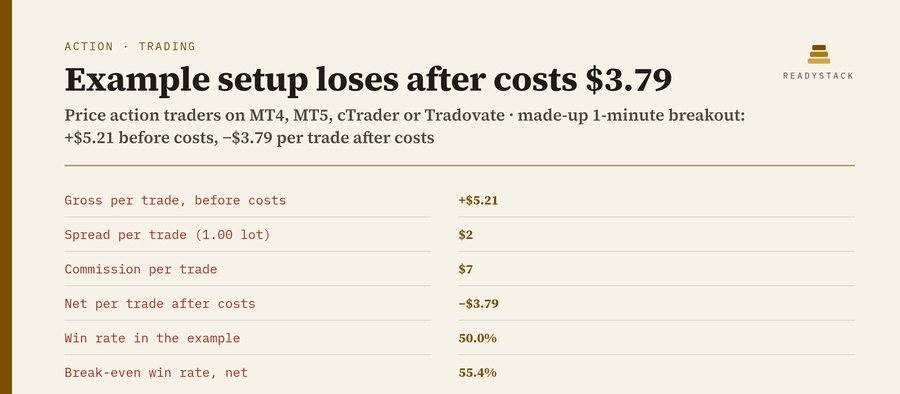
- Spread per trade = lots × your spread per lot. In a broker export it is already inside the result; it is only added back so you see the edge before costs: gross = result + spread.
- Net = gross − spread − extra slippage + commission + swap (commission and negative swap come with a minus from the export). Costs = gross − net. If the export has no fee column, commission = lots × your commission per lot.
- Expectancy per trade = sum ÷ number of trades in the setup; in R = net expectancy ÷ your risk per trade.
- Break-even win rate = average loss ÷ (average win + average loss), both net. If your win rate is below it, the setup loses money.
- Cost buffer = net ÷ lots traded: how many dollars per lot your fills can get worse before the setup lands at 0.
- Worked example A, "1-minute breakout": result +$45.00 + spread 14 × 1.00 lot × $2.00 = $28.00 → gross +$73.00; commission 14 × $7.00 = $98.00; $73.00 − $28.00 − $98.00 = −$53.00; −$53.00 ÷ 14 = −$3.79 per trade.
Times as in your export (your broker's server time). A tool to record and compute your own trades: no signals, not financial advice.

 Shop support inbox: chat and email in one place, every customer answered in their language
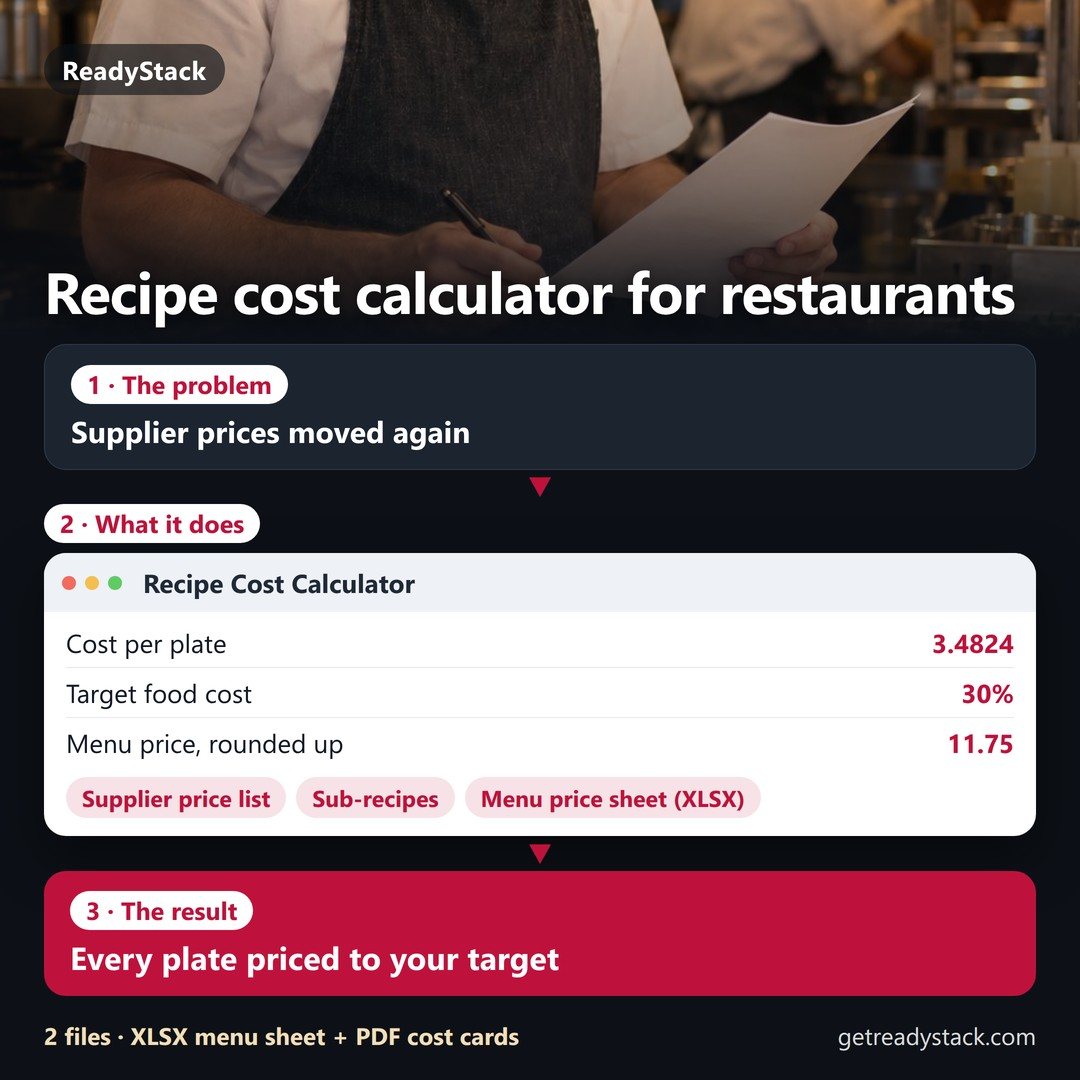 What does this plate cost — and what should it sell for?
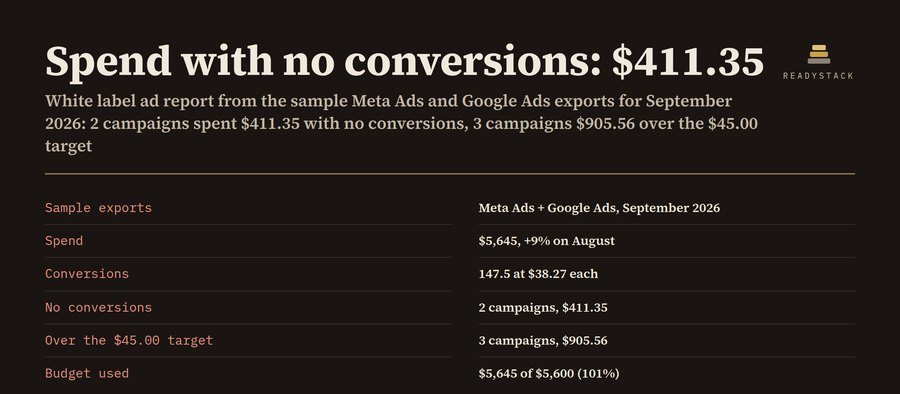 White Label Ad Report Generator for Agencies
 Faceless Shorts Maker
 Amazon Seller Research Extension — sales floor from Amazon's own badge, 2026 FBA fees and margin
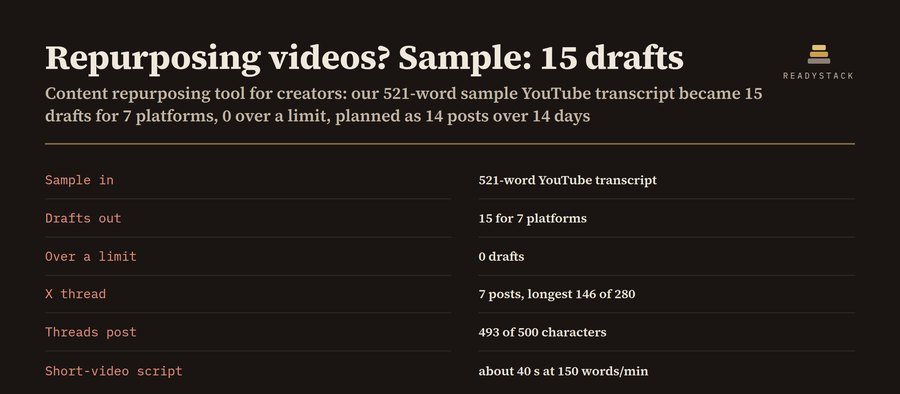 Content Repurposing Tool for Creators