· ReadyStack
Worked example
Real numbers from this tool, line by line.
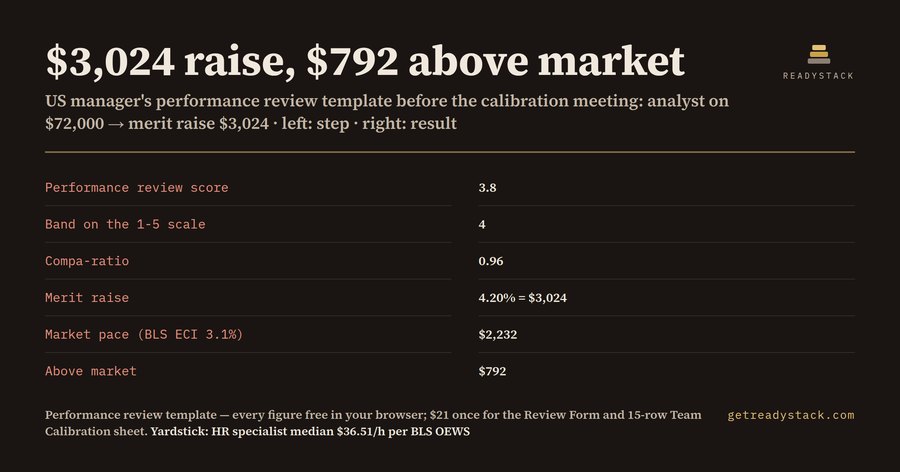
A US manager rating an analyst on $72,000 lands at a $3,024 merit raise, which is $792 above market. That is with a 3.5% merit budget, a $75,000 range midpoint, a goals score of 4 and a competency score of 3.5.
| Step | Result |
|---|---|
| Weighted review score (60% goals) | 3.8 |
| Rating band | 4 |
| Compa-ratio | 0.96 |
| Merit raise | 4.20% = $3,024 |
| New salary | $75,024 |
| Market-pace raise (3.1%) | $2,232 |
| Above market | $792 |
Now change three numbers. The employee is an associate on $61,000 with a $62,000 midpoint, scoring 2 on goals and 2.5 on competencies. The weighted score drops to 2.2 and the band to 2. The multiplier halves, so the raise is 1.75% = $1,068. Keeping pace with the market would take $1,891, so this raise is $823 below market.
The market line comes from a federal figure, not an opinion. BLS Employment Cost Index: private-industry wages and salaries rose 3.1% in the 12 months to June 2026. Any raise under that pace means the employee's pay falls behind the market, whatever the rating says.
Why a blank form is not enough
Most performance review templates are blank forms. They give you rating boxes, comment fields and a signature line, and then they stop. The question every employee asks after the meeting is "what does this mean for my pay?", and a blank form cannot answer it. Calibration has the same gap: HR asks whether the raises fit the merit pool, and nobody has added them up.
How the calculator gets from rating to dollars
The goals and competency scores are weighted into one score from 1 to 5 and rounded to a rating band. The band sets a multiplier on your merit budget: 1.5 for a 5, 1.2 for a 4, 1.0 for a 3, 0.5 for a 2 and zero for a 1. Then compa-ratio adjusts it. Someone paid below 0.90 of the range midpoint gets 1.25 times that raise, and someone above 1.10 gets 0.75 times. That is a starting matrix, not a law, so change it to match your company's policy.
The team view is where budgets break
The workbook's Team Calibration sheet holds 15 employee rows. Its four example employees have a payroll of $333,000. A 3.5% budget gives a pool of $11,655, while the matrix hands out $14,140 in raises, overspent by $2,485. You want to find that the evening before calibration, not in the meeting.
What is free
The web calculator is free, with no account. It shows one employee's whole answer from your own numbers. The workbook adds the printable Review Form, with 3 weighted goals, 5 competencies, comments and 3 signature lines, plus the Team Calibration sheet. It opens in Excel, or in Google Sheets through File, Import, Upload.
The yardstick
BLS OEWS 2025: Human Resources Specialists median $36.51/h; Compensation, Benefits and Job Analysis Specialists median $37.60/h. One hour of someone building a merit matrix by hand costs more than the workbook does.
Put in your employee's scores and salary before the review meeting, and check the gap to market line before you say a number out loud.
15 seconds — what it actually does
Questions people ask
What does this performance review template calculate?
You enter the goals and competency scores. It weights them into one score and sets a rating band from 1 to 5. Then it applies a merit matrix based on compa-ratio and returns the raise in dollars and the new salary. The default example is a $72,000 employee rated 4. The answer is a 4.2% raise of $3,024, which is $792 above the 3.1% BLS ECI market pace.
Who is this performance review template for?
It is for US people managers and HR generalists running annual reviews. Each rating has to become a merit raise that survives calibration and matches the merit budget. It suits teams that score goals and competencies on a 1-5 scale and have salary ranges with a midpoint. It works for one direct report or a full team.
Why not use a free performance review template?
Free performance review templates are blank forms that stop at the rating. They never turn a 4 out of 5 into dollars or compare the raise with market wage growth. BLS Employment Cost Index: private-industry wages and salaries rose 3.1% in the 12 months to June 2026, so a 2.5% raise for a solid performer is still a pay cut against the market.
What is free and what does the $21 file add?
The web calculator is free with no account. It shows one employee's whole answer: score, band, compa-ratio, merit raise % and dollars, new salary and the market gap. The $21 .xlsx adds the printable Review Form and a Team Calibration sheet with 15 employee rows. Each row computes its own raise, and the total is checked against your merit pool.
How does $21 compare with doing this by hand?
BLS OEWS 2025: Human Resources Specialists median $36.51/h; Compensation, Benefits and Job Analysis Specialists median $37.60/h. One hour of an analyst building a merit matrix and checking it against ECI already costs more than this one-time $21 file. You keep the file and reuse it every review cycle.
Ask about this tool
One question, answered by the person who built it. Your email only if you want the answer sent.